For people interested to be able to work with the Jenkins and Nexus into containers, i have created an infra configuration with docker that you can find here:
It this post, i will explain how to be able to use Kraft and why use it.
Kraf is a concensus protocol allowing Kafka to work independently without Zookeeper.
This simplifies the fact there is nore more need of two different services (Kafka and Zookeeper) to share metadata. It also enables kafka fail over control to be almost instant. Thus the effect of kafka start and stop is faster.
The feature began with the version Kafka 2.8 and is enhanced with every new version BUT for the moment (June 2022), this solution is not yet production ready.
Of course this changes a little the infrastructure and the connection method.
With Zookeeper
Without Zookeeper
Client and service configuration
zookeeper.connect=zookeeper:2181
bootstrap.servers=broker:9092
Schema registry configuration
kafkastore.connection.url=zookeeper:2181
kafkastore.bootstrap.servers=broker:9092
Kafka admin tool
kafka-topics –zookeeper zookeeper:2181
kafka-topics –bootstrap-server broker:9092 … –command-config properties to connect to brokers
REST Proxy API
v1
v2 and v3
Get Cluster ID
zookeeper-shell zookeeper:2181 get/cluster/id
kafka-metadata-quorum or view metadata.properties or confluent cluster describe --url http://broker:8090 --output json
In this post, i will show you how to work with MongoDB Cloud. The good point is that MongoDB offers a free version that you can test with a limitation of 512 mega bytes which is a good starting point.
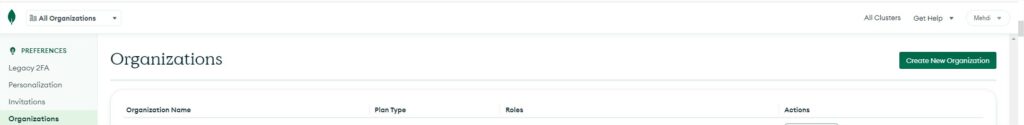
Organization can help to wrapp your projects and databases for instance in regions, departements or any idea you could have to separate your information. Click on the green button on the top left “Create New Organization”. Provide a name to your new organization.
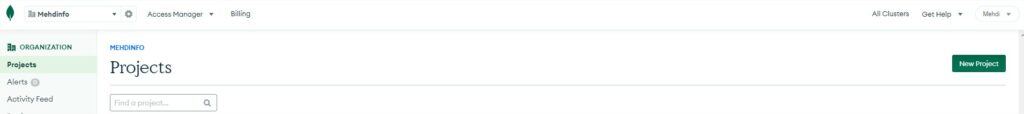
Select your new organization and create new Project. Click on the green button on the top left “New Project”. Provide a name to your new project.
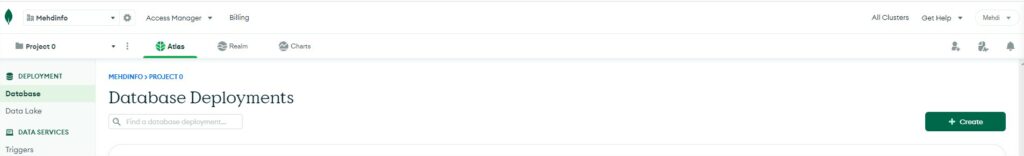
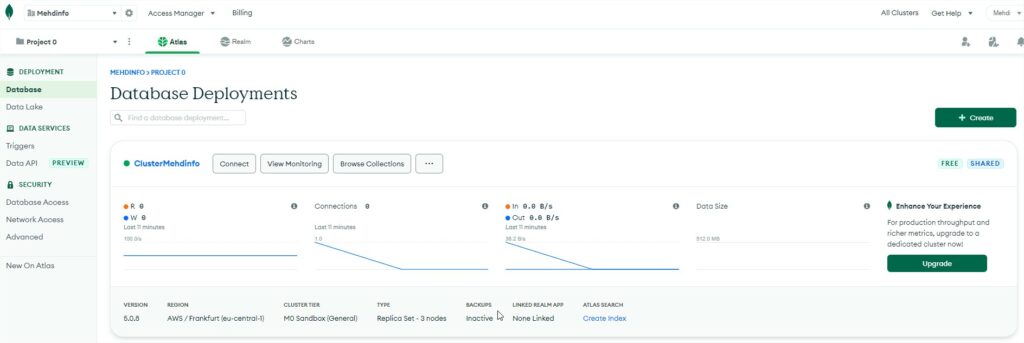
Select your new project and create a new Database. Click on the green button on the top left “+ Create”.
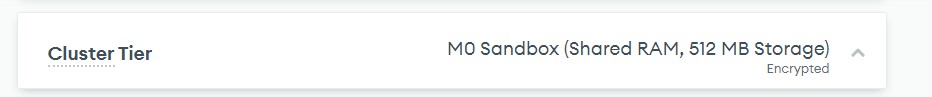
During the creation process, keep the cluster tier configuration to 512MB Storage and change de cluster name. The cluster will be composed of 3 loadbalanced mongodb servers.
Wait until the cluster creation process is completed. You will end up with cluster up and running.
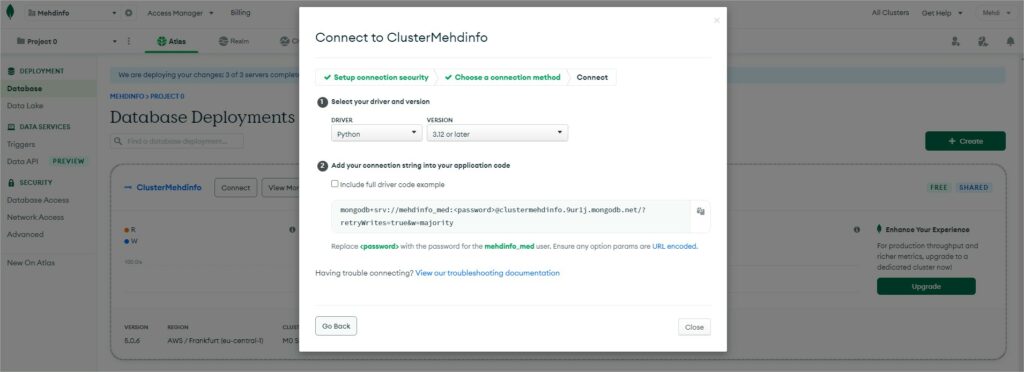
If you click on the button “Connect” and choose “Connect your application”, this will show some snippet code example for many different programming language such as Java, Python, GO, Perl, C, C++, C#, …
In my demo i will choose Python and a future post will be created with a git repo containing python code example to connect to mongodb, create a collection and apply CRUD operations to json documents.
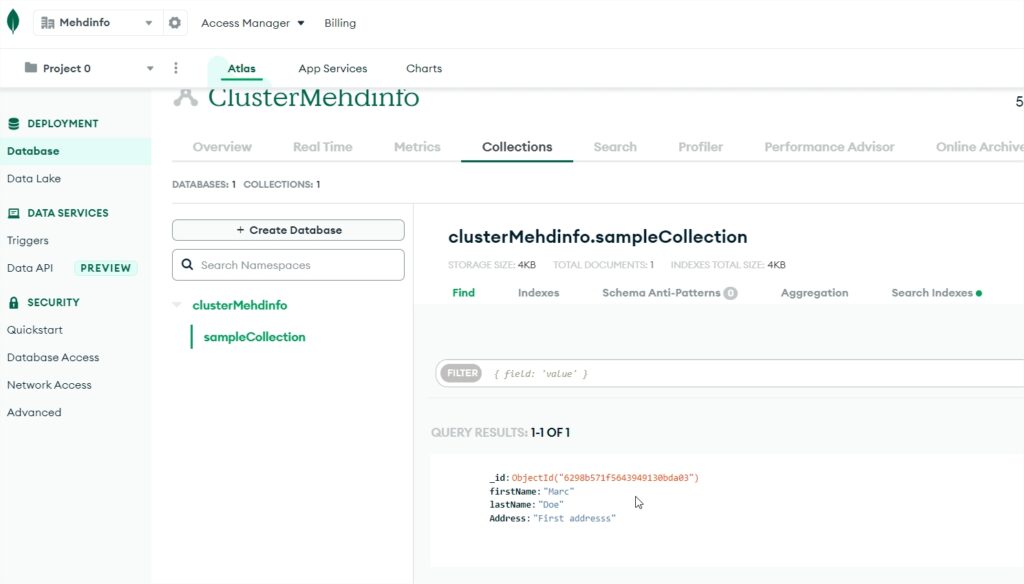
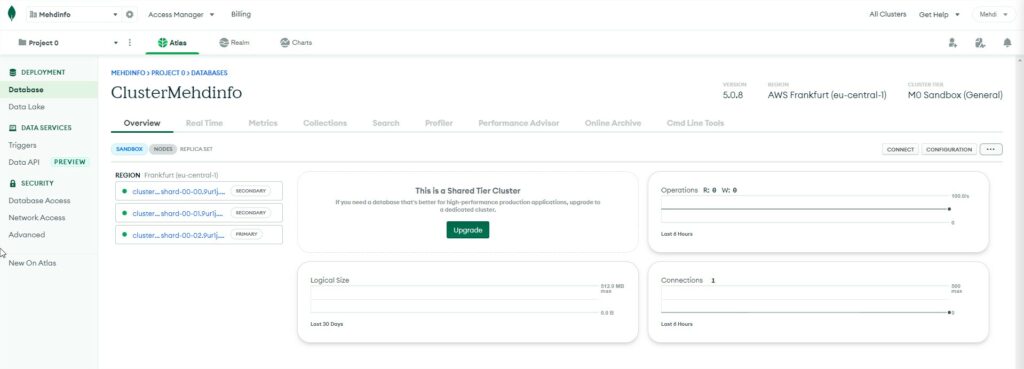
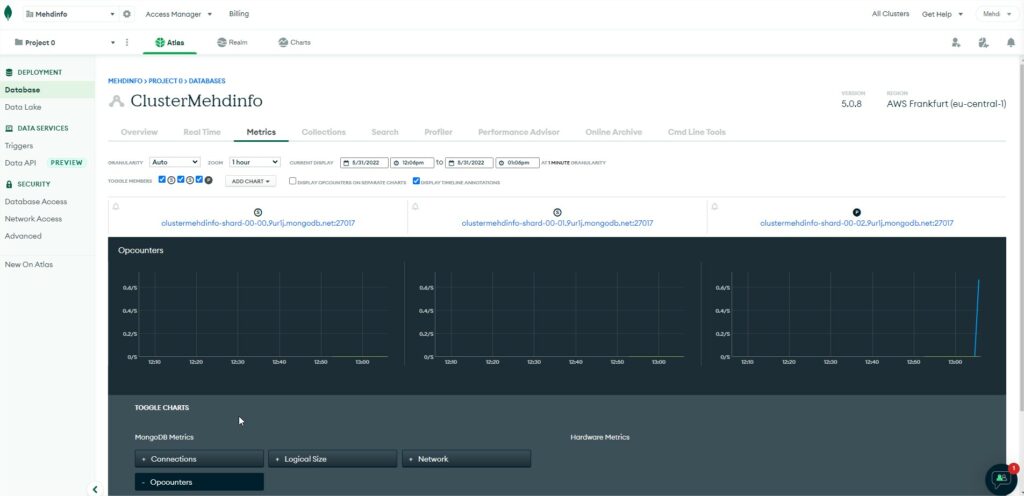
Now if you select the cluster by clicking on it, you will arrive to the cluster overview page.
Select the “Metrics” tab and you will get an overview of the operation counters for the 3 servers.
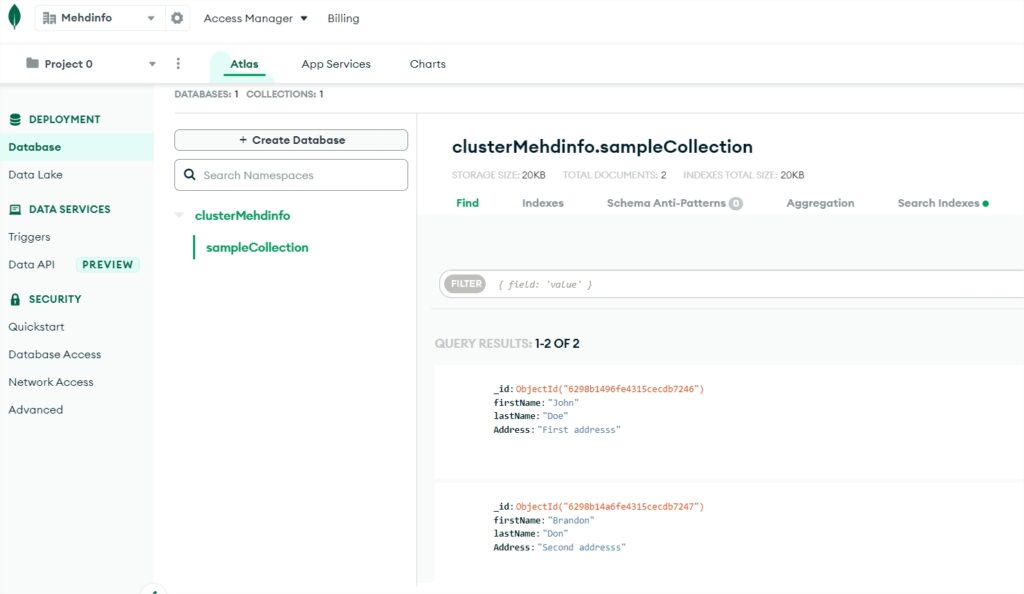
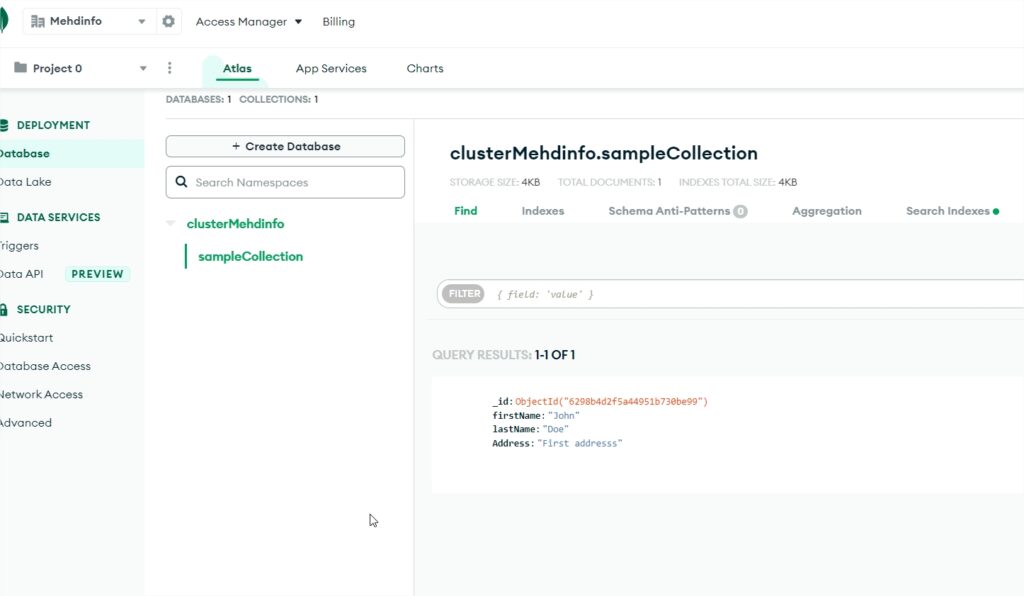
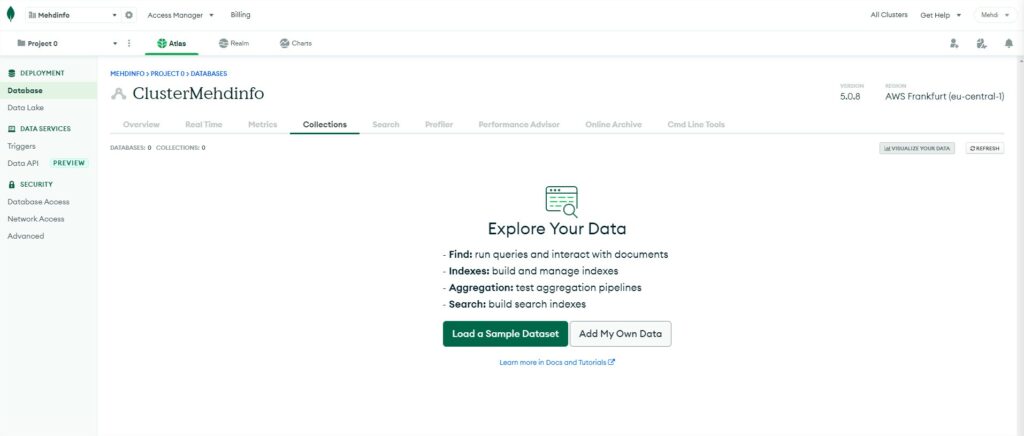
Select the “Collections” tab to browse data documents.
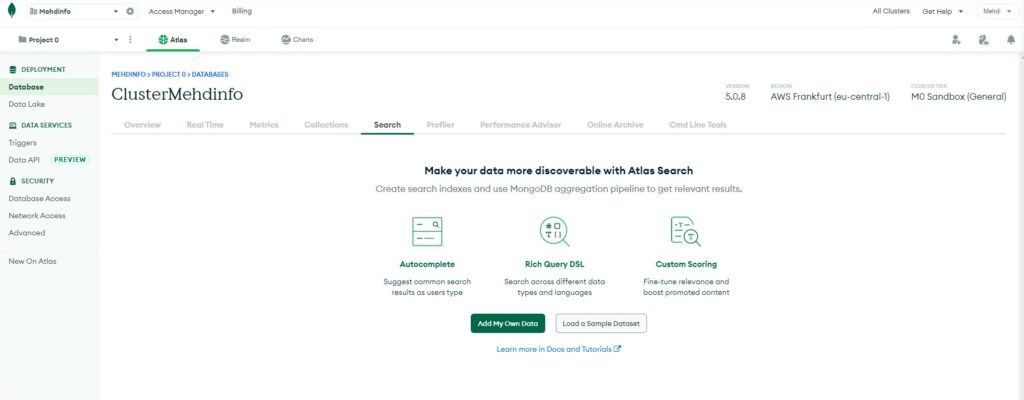
Select to “Search” tab to run DSL queries.
The “Profiler” tab, “Performance Advisor” tab, “Online archive” tab are only available with a paid plan so let’s skip those three options.
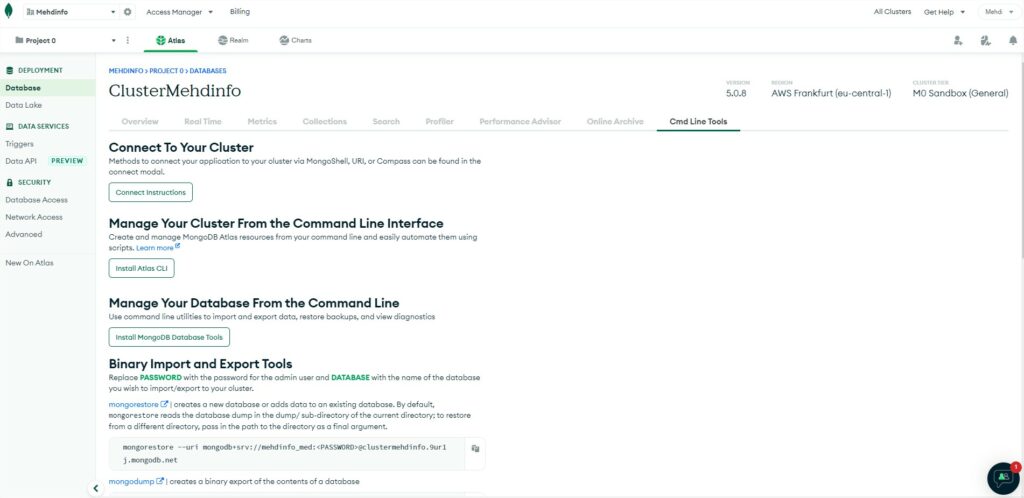
The last tab “Cmd line tools” will help you to see all the options to run command lines:
Connect instructions: will help you to connect from shell or programming language or with MongoDB Compass (GUI to browse and manage your Databases).
Atlas CLI: tool to install to manage DB by command line from brew for MacOS, yum or apt or tar.gz or deb or rpm for Linux or msi or zip for Windows.
MongoDB Database tools: is a suite of useful command lines to install on MacOs, Linux or Windows.
Mongorestore (binary exec file): is a tool to restore data comming from a dump (of Mongodump).
Mongodump (binary exec file): is a tool to create binary dump from a database.
Mongoimport (binary exec file): is a tool to import data from a csv, json, tsv file.
Mongoexport (binary exec file): is a tool to export data to a csv, json file.
Mongostat (binary exec file): is a tool to get metadata of a mongodb service.
Mongotop (binary exec file): is a tool providing time run for read write transaction of mongodb service.
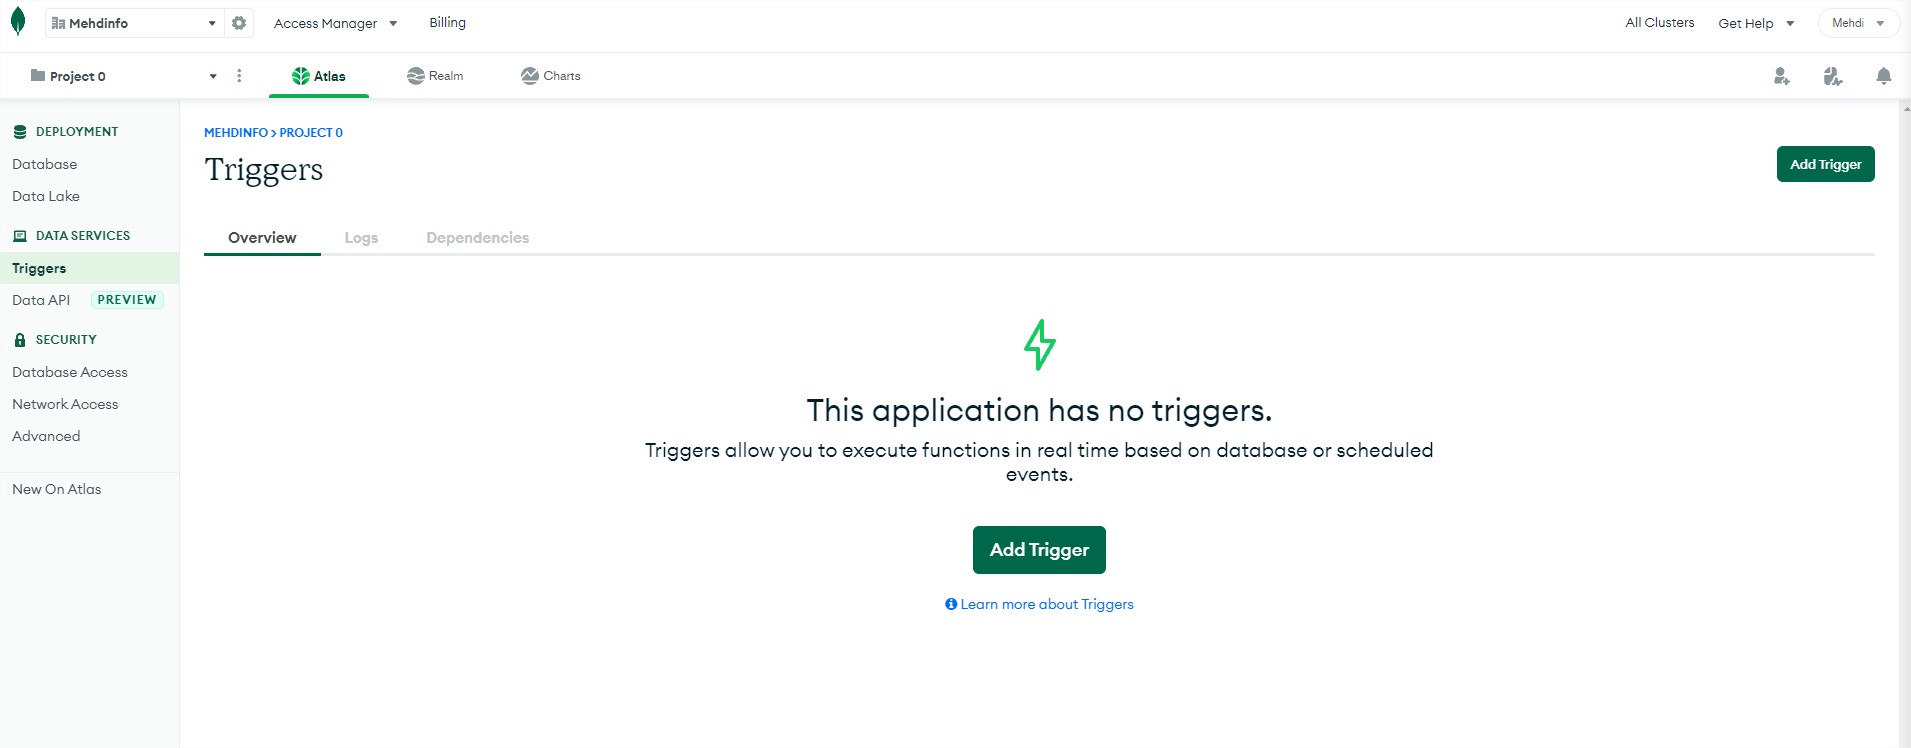
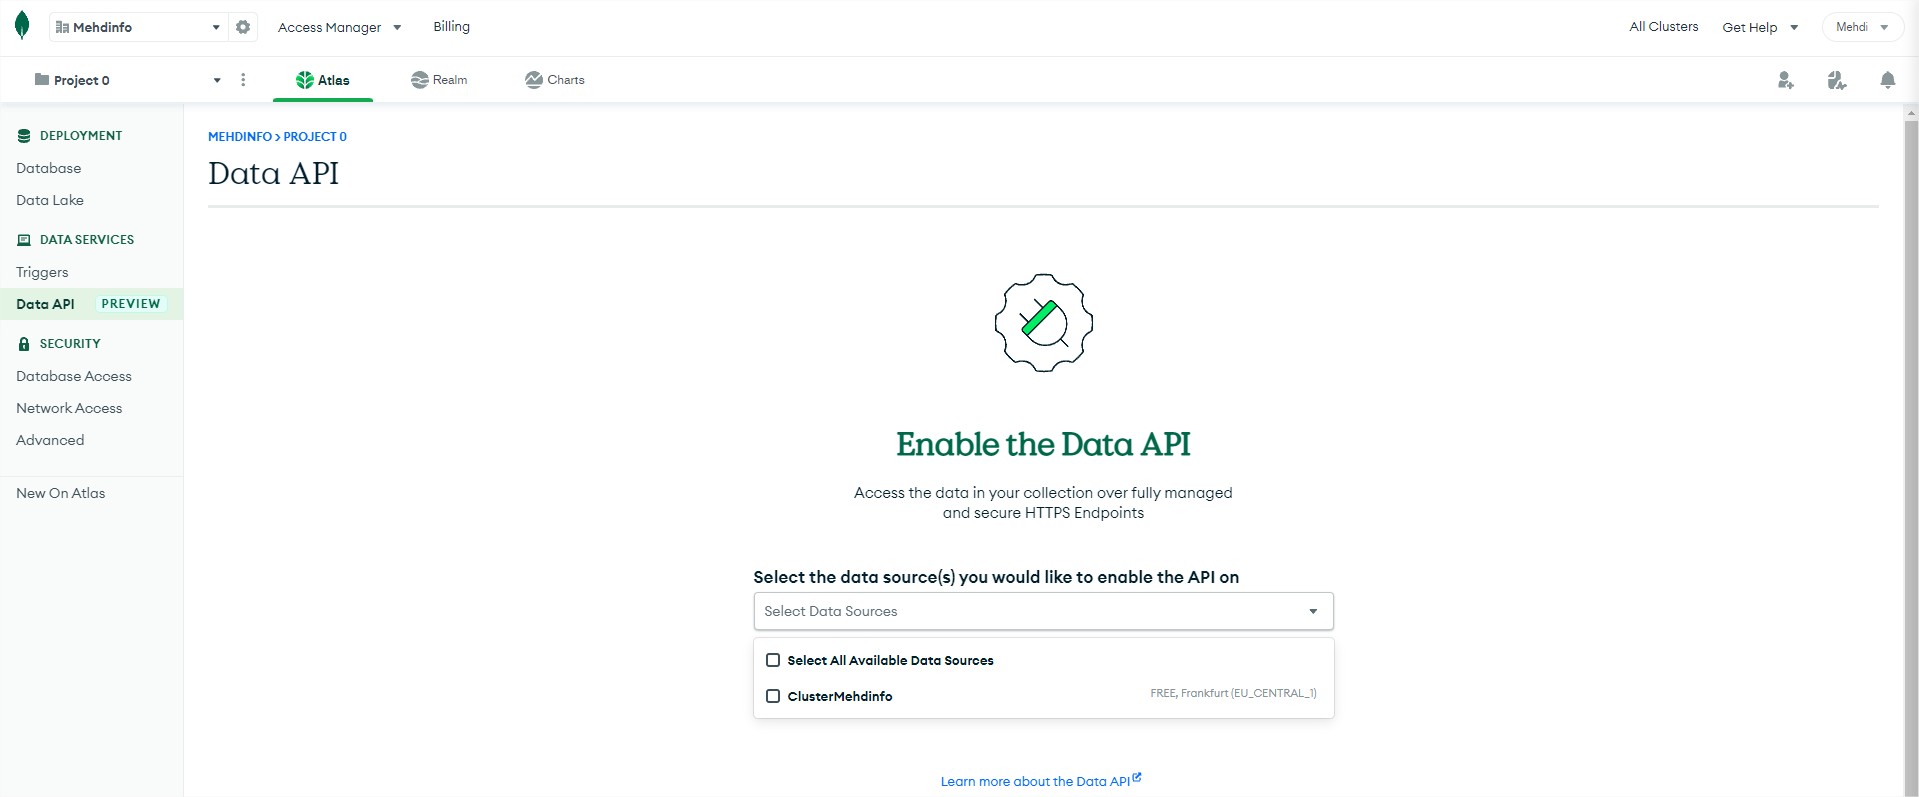
In the DATA SERVICES section, you will see two different options:
Triggers: allow you to run events based on crud operation that occured in a collection but you can also use the schedulded trigger to cron the code to execute.
Data API: allow you to operate actions on one of multiple collections.
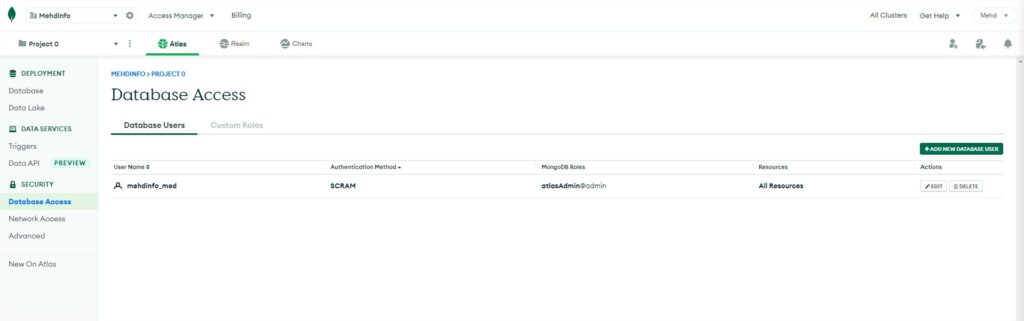
In the SECURITY section, you will see three different options:
Database access: this option is very important. This is where you will manage your IAM. You can create users with the option user/password access, of user/certificate access or link your Amazon WS IAM to manage your users. Each user can be configured with some basic roles attribution.
Network access: this option allows you to create an access list to filter the IP that will be allowed or denied to access the DB.
Advanced: this option allows you enable LDAP feature, data encryption and audit feature.
One last point i would like to mention is that if you would like to get a free to access any mongodb, i suggest you to download this free tool “MongoDB Compass”, you find it here ==> https://www.mongodb.com/products/compass
This concludes this small topic about Cloud Atlas.
It allows to visualize the configuration of queue managers but also the data state and also metadata of each objects (such as queues, topics, subscriptions, …).
It is either usefull for developers to debug and configure their objects for their future development or useful for administrator to configure objects or export configurations.
After installing the MQ for Developers edition, start the MQ Explorer software.
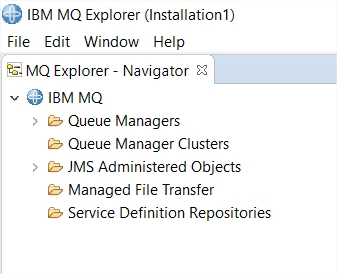
When the tool is running, you will see in the top left corner eclipse view MQ Explorer – Navigator tab.
Lets begin by explaining each elements:
Queue Managers: This is one of the most import element. It allows to create a new local queue manager, transfert local queue manager to a distant server, connect to a remote queue manager but also run tests on all the local and remote queue managers configured.
Queue Manager Cluster: This element allowd to create a Queue manager cluster. This is will help to configure all the channel senders and receivers usefull to have an up and running cluster. The cluster configuration can be made by two different options:
Full repository: each QM member of the cluster will sync everything objects and data.
Partial repository: each QM member of the cluster will only sny objects. Data wont be synchronized.
The choice between the two options can have an impact on the network bandwith, The fact that only the objects must be the same but the queue managers will be separated in region for instance (Europe region will not have the same data than the Asian region but the softwares putting data will have the same behavior in Europe and in Asia).
JMS Administered Objects: This element is usefull to create a binding JNDI configuration file to share with developers. Each binding file will have the connection details to connect to a queue manager, a queue manager HA, a queue manager cluster and also destination queues/topics to send data. This allows to control and restrict the queues and topics availability.
Manage File Transfer: For those who have the feature MQ FT enabled on at least two different queue managers and that you configured your agents, this options allows to test, trace and configuration file transfer. It is also possible to cron file transfer from the MQ Explorer.
Service Definition Repositories: This option is less used than before. This allows to create a documentation that will become a WSDL to deploy to get description and documentation information. It can be compared to IBM WSRR.
What is an ingest pipeline: it is a watcher analyzing data entering to an index and beforing being save can be transformed.
Possible actions: The transformation options available are: remove field, add field, enrich value of a field, convert field type.
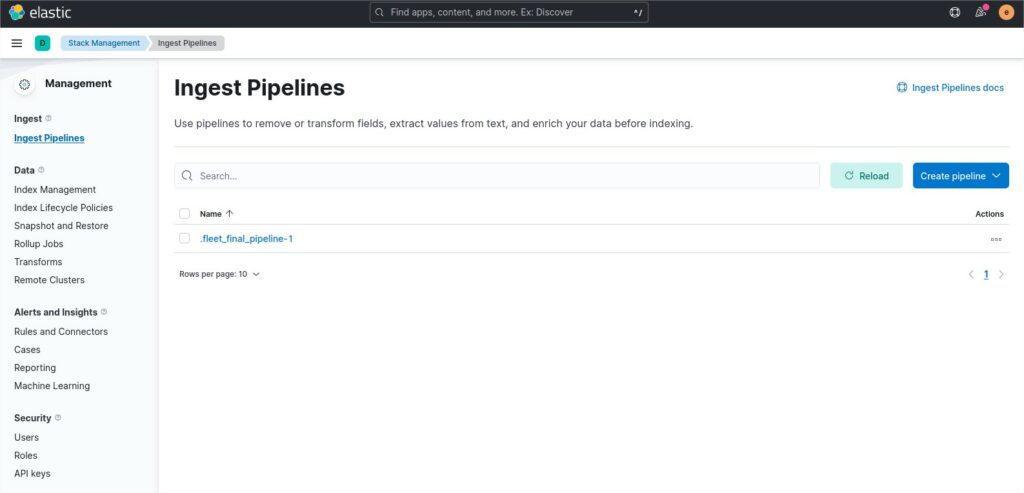
The ingest pipeline option is located into the Stack Management section.
Use case:
If you have logstash between an agent or a software feeding data to elastic, you may use filter and/or grok system to do the same actions than an ingest pipeline.
But if you have agents or softwares feeding data directly to elastic and would like to manipulate data before being indexed you can use the ingest pipeline to do transformation.
It is also a good use case when you are now allowed to change the agent or the software that feed the data.
How to use it:
In the image above, you see the home page of the ingest pipeline menu.
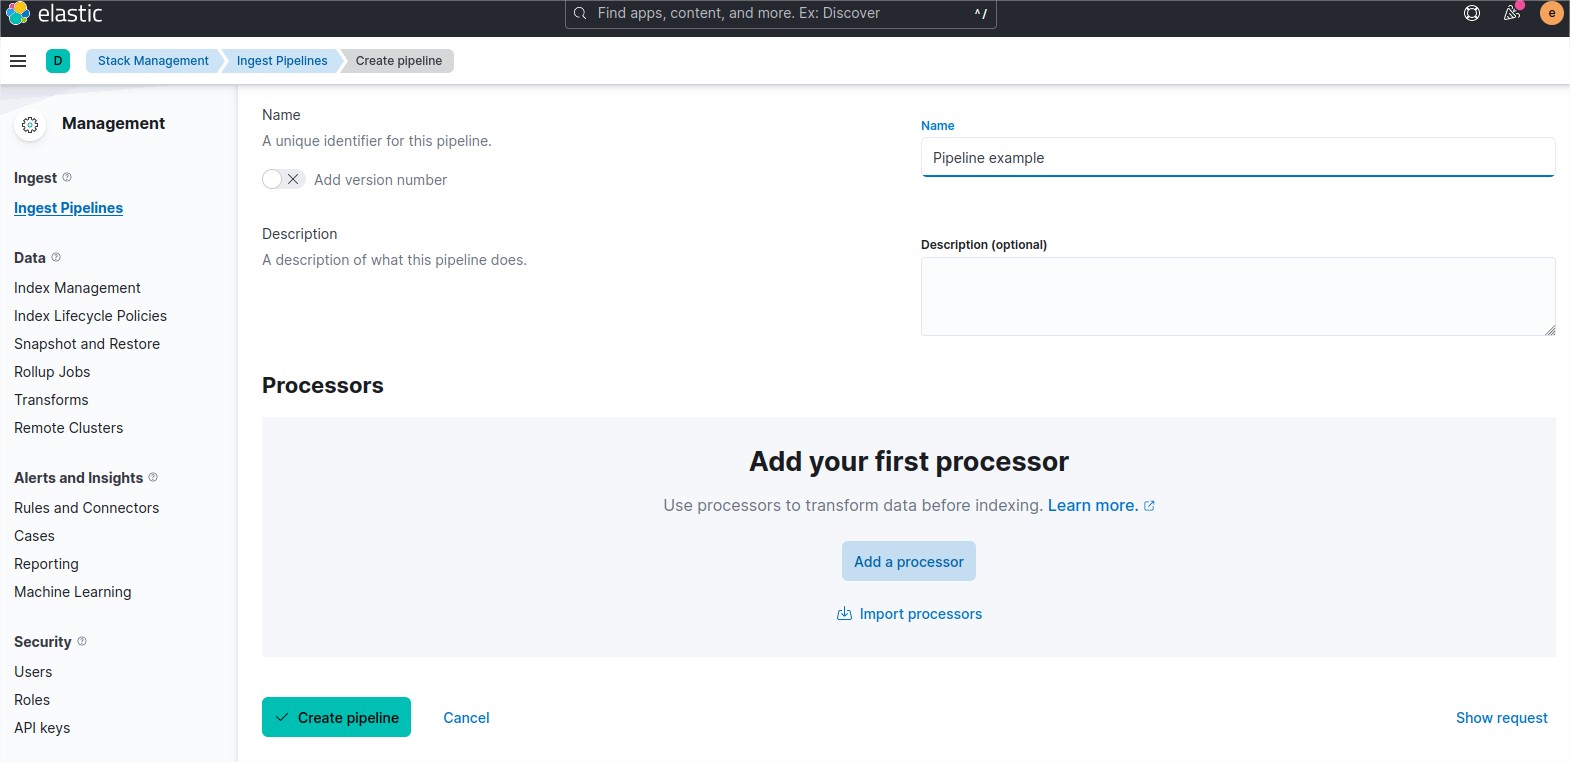
Clic on the blue button “Create pipeline”. Choose “New pipeline“.
Give a relevant name to your new pipeline and a small description.
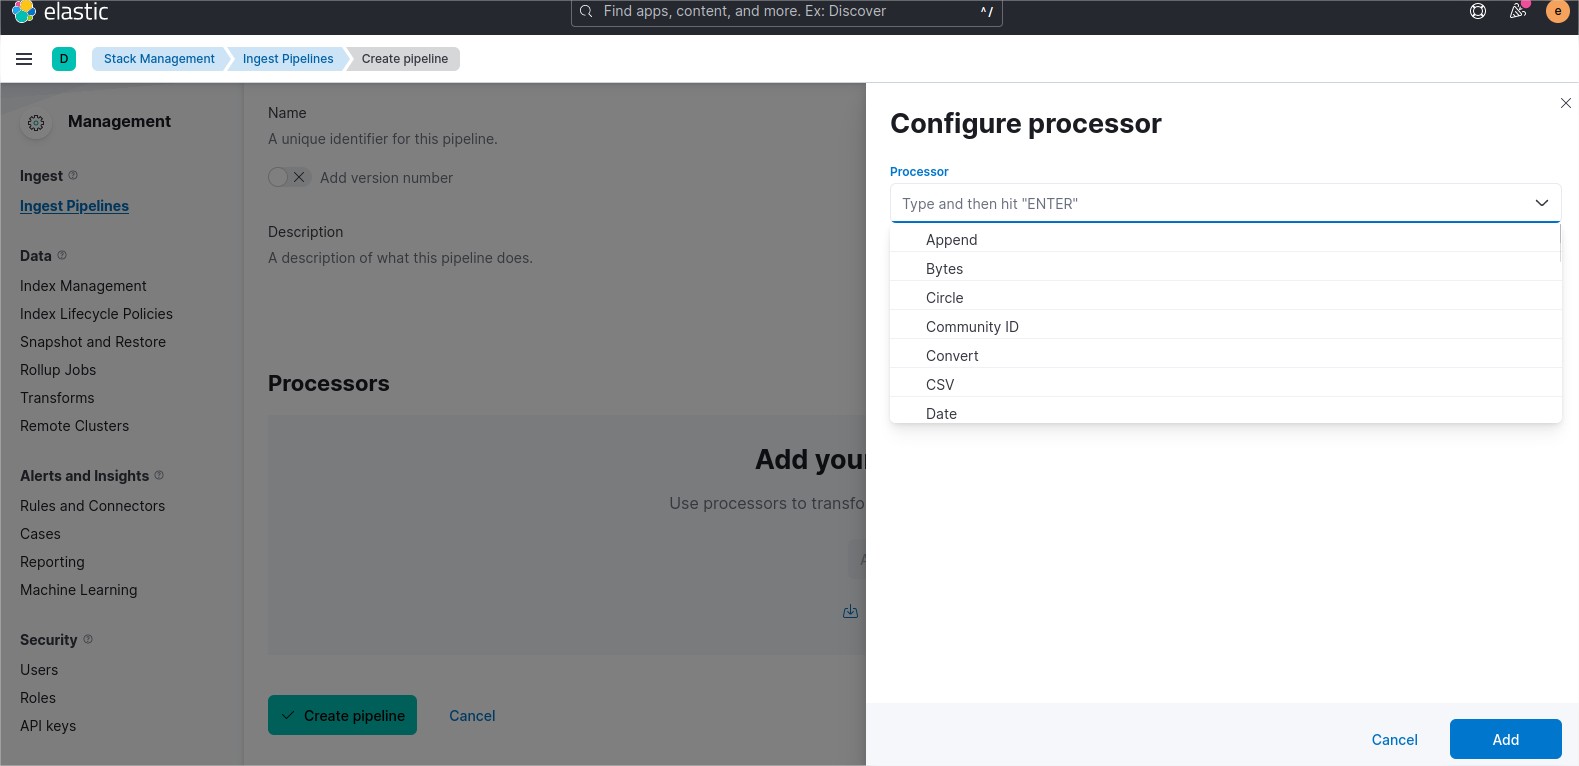
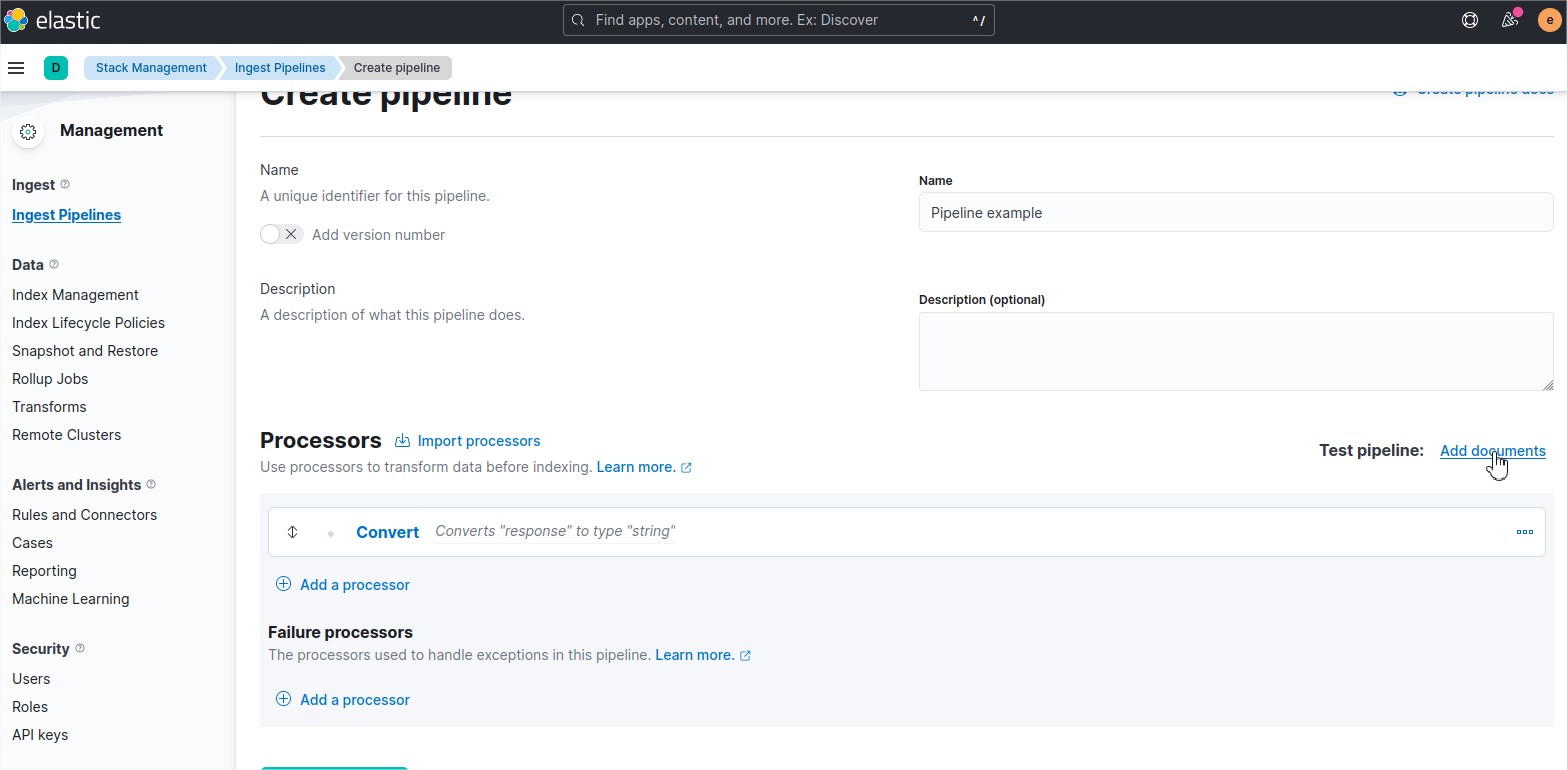
Clic on the button add processor. You can add many processor in the same pipeline.
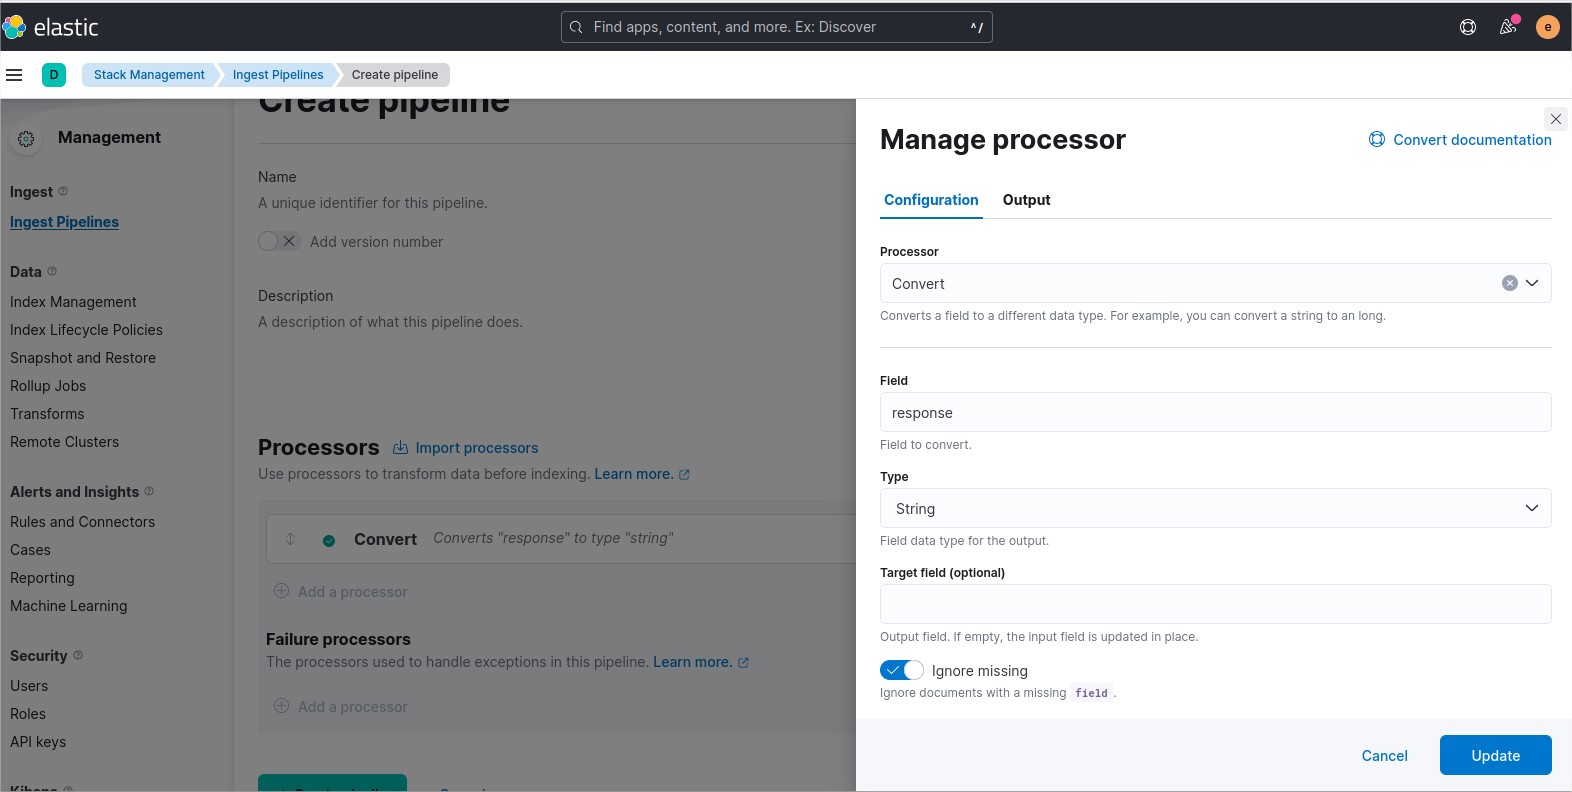
In my example i convert the type of a field from integer to string.
I will use the json field response.
Next click on the button “Add”.
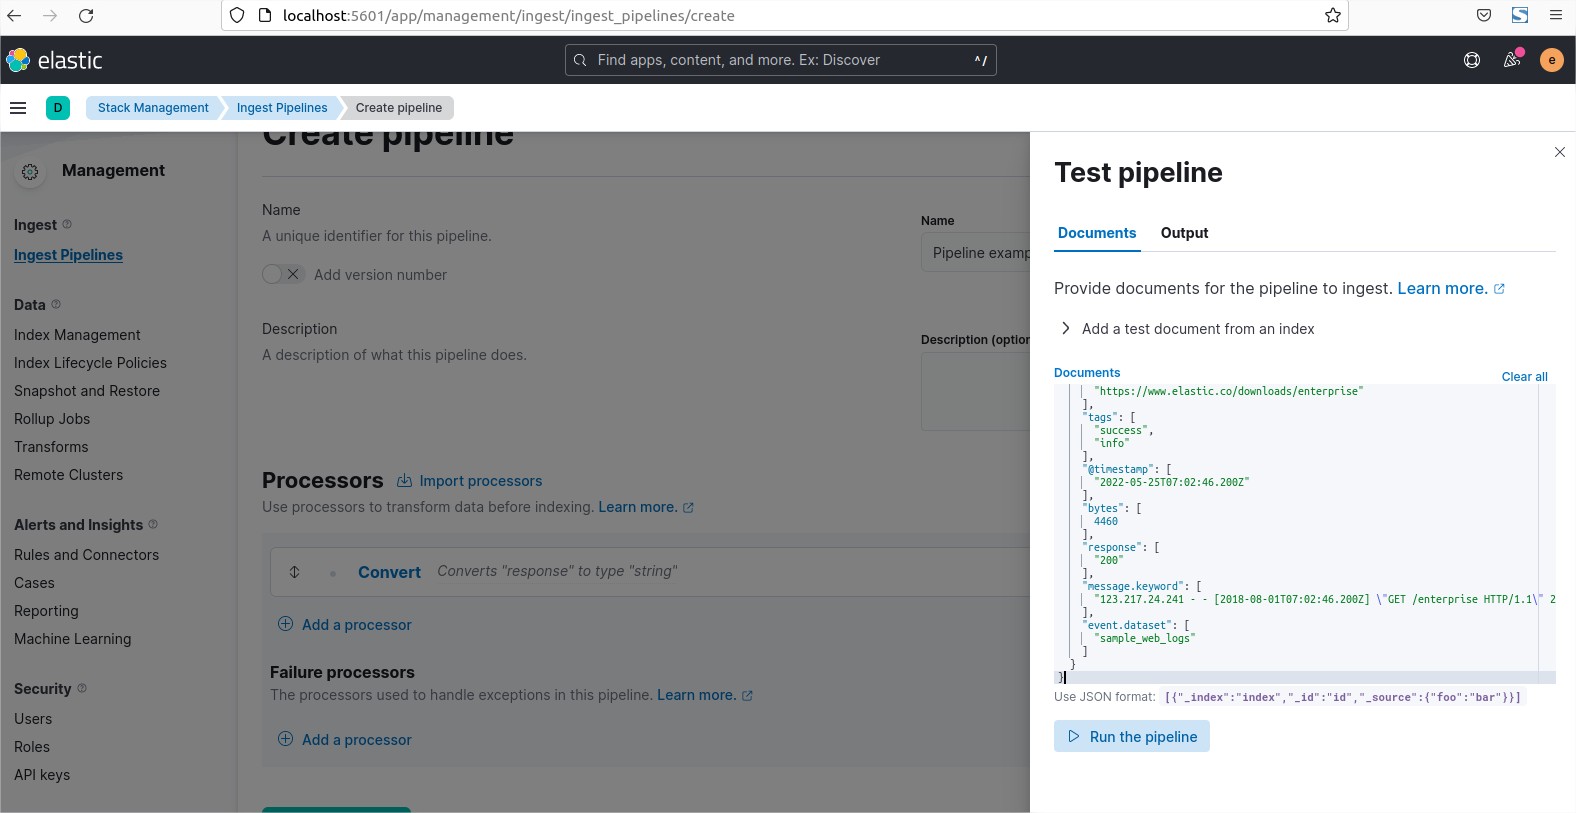
In front of the text “Test Pipeline:” Click on the link “Add documents”.
Insert a json sample you would like to test and run the test with the button “Run the pipeline”.
See the result if the transformation worked.
When your pipeline is complete, it is possible to save its configuration as an HTTP PUT request which will allow you to deploy it on other ELK environment or clusters.
Here is the json sample i used, see the field in red below:
To create an alert from the dev tool, we are going to send to the Watch API of elastic an HTTP PUT operation
In this exampl the alert is configured with a cron, targets all the logstash indexes, search for the 404 reponse in the json body field during a certain time range, if the condition matches, an email is sent.
The alerting can really help to monitor message passing through the log, but there are some limitations.
To be able to use some connectors, the minimum subscription is to have the GOLD subscription.
With the free and basic subscription, the only connector available are Log server (Write your message alert into a log file), Index (Create an index with your message alert into it).
So without a GOLD subscription, i suggest to not focus a lot on alerting seen that the only connector types will need another monitoring system to be notified.
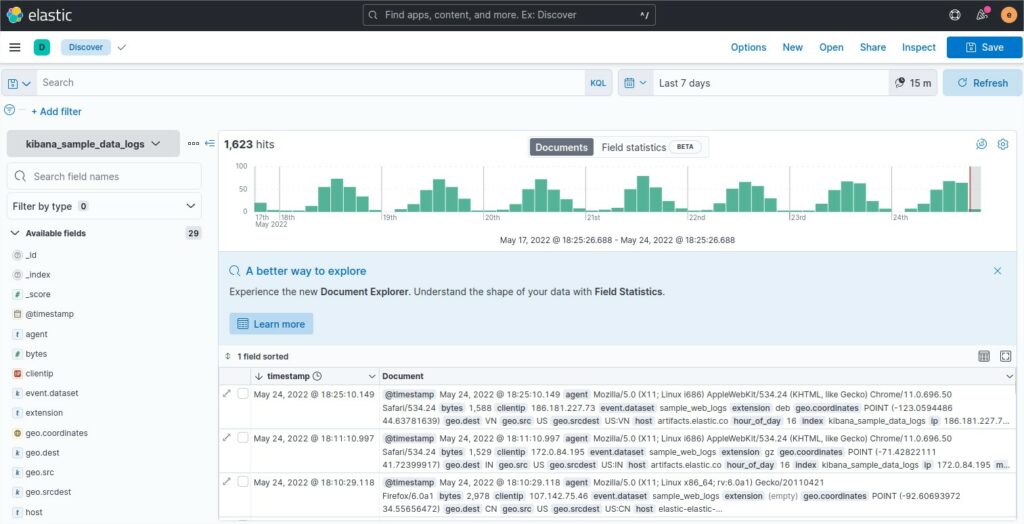
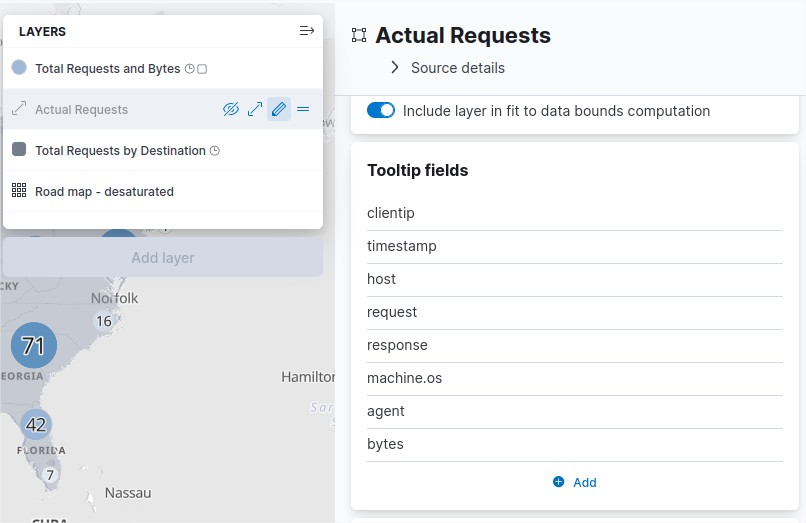
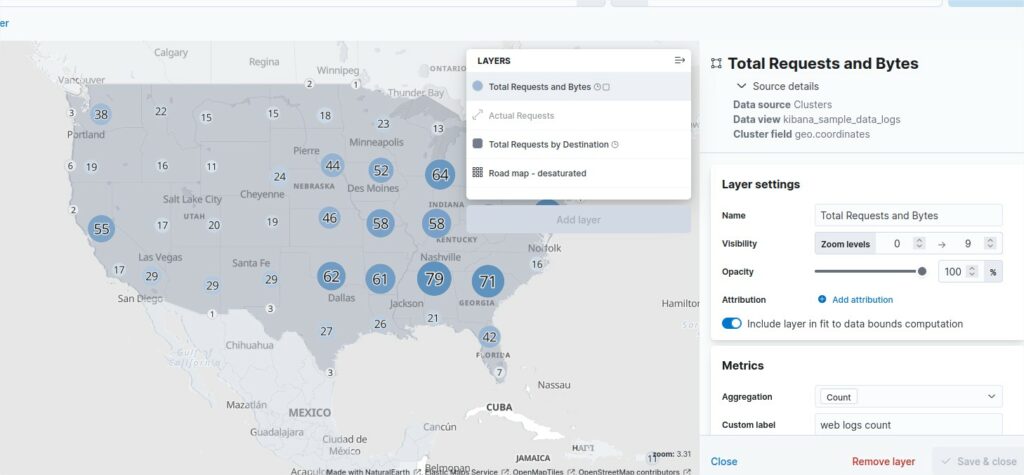
If you check the dashboard of the sample called “[Logs] Total Requests and Bytes” and the data, there is a link between a the worldmap and this part of data
“agent”: “Mozilla/5.0 (X11; Linux i686) AppleWebKit/534.24 (KHTML, like Gecko) Chrome/11.0.696.50 Safari/534.24”,